Map of the Week – Education and Ocean Literacy

The European Marine Science Educators Association (EMSEA ) annual conference was held this week on 16-17th October in Batumi, Georgia. This year, EMSEA celebrates its 10th year anniversary! The conference highlighted effective education and training practices, which aim at enhancing knowledge of the marine environment, fostering the growth of the blue economy, and facilitating maritime career opportunities. The conference also provided a platform for networking and regional discussions on Ocean Literacy within the Black Sea region as well as with the broader EMSEA community. EMSEA is a community of European marine (science) education, aiming to promote ocean literacy locally and regionally via a network of marine scientists, educators, blue economy enterprises, policy makers, and the public. Under the framework of the BRIDGE-BS project, EMSEA is going to establish a Black Sea Literacy Network.
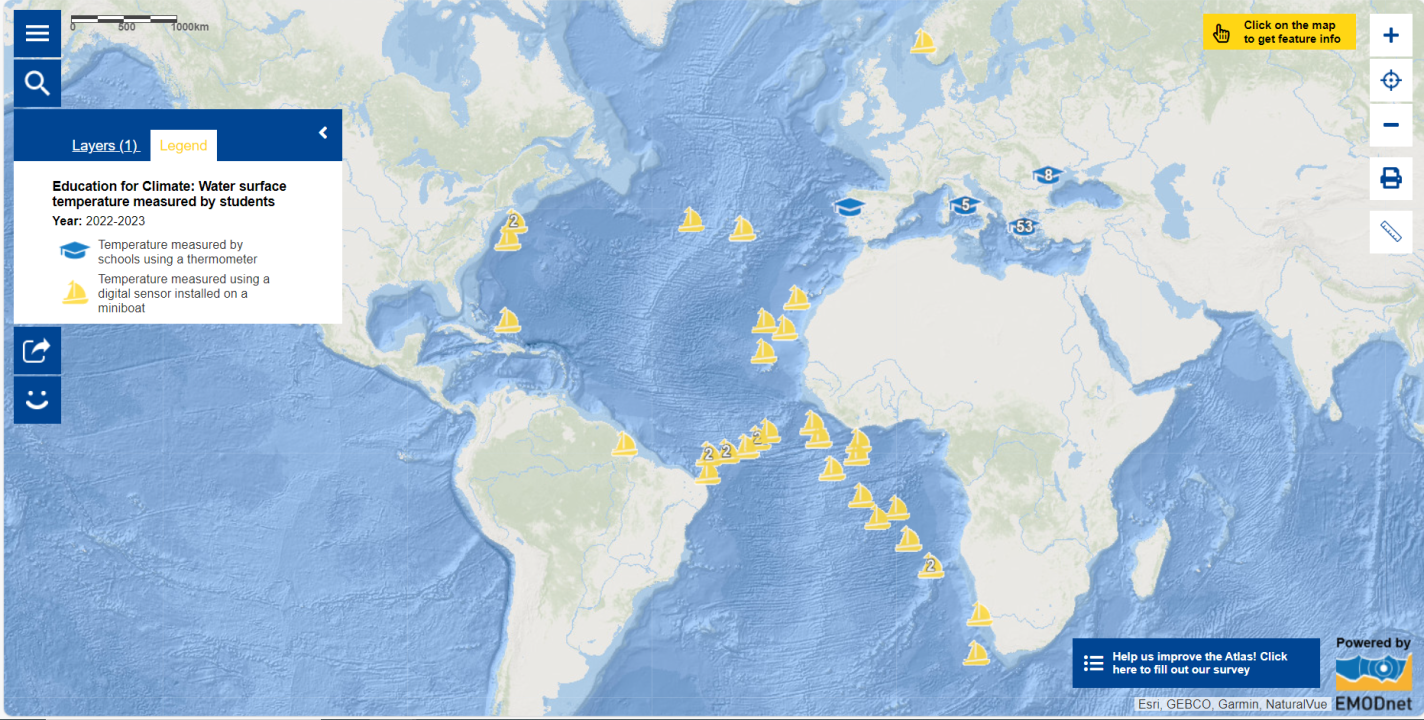
In recent years, a higher focus has been put on practical-based learning in education. This involves conducting experiments and acquiring hands-on experience. This approach enables students to learn-by-doing and to effectively develop practical skills, including problem-solving, collaboration, communication, and critical thinking. In the field of marine science education, many organisations have been providing such practical-based learning opportunities. The Map of the Week shows water surface temperature measured by schools! It is the educational outcome of the challenge 'Be a scientist! Mapping climate change at seas & waterways' launched by the Education for Climate Coalition and the European Atlas of the Seas in 2022. Schools across Europe were invited to become data providers for a new map layer in the Atlas. The challenge includes 8 phases. Students learned about data collection, data harmonisation, data visualisation and data sharing. Several schools used a thermometer to measure water temperature. In addition, thanks to the collaboration of the Partnership for Observation of the Global Ocean (POGO ) and Educational Passages , the map layer also includes data from schools who have built miniboats deployed at sea which are equipped with temperature sensors! Explore the map by clicking on the locations where the temperature was measured to read information about when, where and how the measurement was made as well as who made the measurement! Thank you to all contributing schools, to POGO and to Educational Passage for their wonderful contribution!
Do you wish you had contributed to this map layer? Would you like to work on the ocean at your school? Read below how you can do this!
- The Education for Climate challenge has now entered the phase ‘Let's enrich our map!’. The data collection is thus open again and you can contribute data until 31 December 2023! How? Follow the instructions to collect data, report data in the online data collection form and see your data included in next year’s update of the map layer! Please note that all measurements should be made by teachers or under the supervision and guidance from teachers. Always ensure everyone's safety before making a measurement.
- ‘Find the blue’ and join the Network of European Blue Schools to become agents for change for ocean sustainability!!
- Explore resources in marine education provided on the EMSEA website!
- Discover map-based games in the European Atlas of the Seas’ Teachers Corner!
The data in this map are provided by the Education for Climate Community.
