Map of the Week – Climate Change – Global Mean Sea Level Regional Trend

The United Nations (UN) Climate Change Conference - COP 28 - started on 30 November 2023 and is expected to end on 12 December 2023. COP 28 stands for the 28th meeting of the Conference of the Parties (COP) to the United Nations Framework Convention on Climate Change (UNFCCC). COPs take place every year, and are the world’s only multilateral decision-making forum on climate change with almost complete membership of every country in the world. The COP is thus where the world comes together to agree on ways to address the climate crisis, such as limiting global temperature rise to 1.5 degrees Celsius, helping vulnerable communities adapt to the effects of climate change, and achieving net-zero emissions by 2050. [1]
Many events are taking place during COP28, some of which are livestreamed or organised online. How can you follow COP28? How can you be informed about activities related to the Ocean?
- Have a look at the UN Climate Change news ;
- Check out the public webcast schedule ;
- Learn about the COP28 UNESCO / OCEAN X Pavilion ;
- Discover the COP28 Virtual Ocean Pavilion .
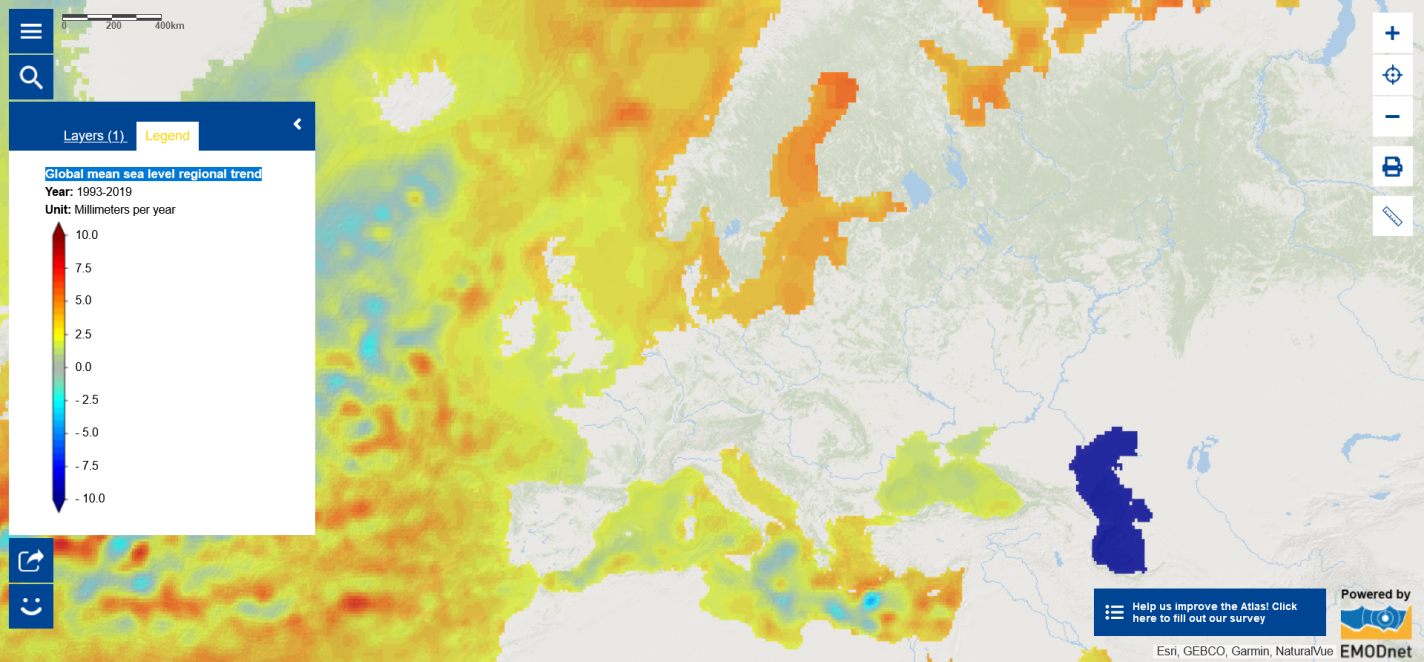
In this context, the Map of the Week focuses on sea level rise. Sea level is rising as a result of ocean heating and land ice-mass loss. Water expands when heated and about 30% of contemporary global mean sea level rise can be attributed to this thermal expansion alone. Sea level rise can seriously affect human populations in coastal and island regions as well as natural environments such as marine ecosystems. Average global sea level rose by more than 8 cm between the early 1990’s and 2019. Global mean sea level rise is accelerating. Sea levels do not rise homogeneously as can be seen from the map that shows the spatial distribution of sea level trends since 1993. Some regions are more threatened than others. Sea level is rising for the vast majority of the global ocean but there is large-scale variation. Understanding sea level rise is essential for adequate climate change adaptation.
Wish to learn more about climate change?
- Explore the Copernicus Marine Service Ocean data visualisation tools ;
- Read the European Environment Agency briefing ‘How climate change impacts marine life’;
- Have a look at the World Meteorological Organisation’s Provisional State of the Global Climate in 2023 report ;
- Discover the agenda and content of the COP28 Virtual Ocean Pavilion ;
- Find out about local climate action with the Convenant of Mayors for Climate & Energy Europe;
- Learn about climate change adaptation with the European Climate Adaptation Platform Climate-ADAPT;
- Engage your school in climate action with the Education for Climate Coalition!
The data in this map are provided by the Copernicus Marine Service.
