New pan-European shoreline-migration map based on field measurements and aerial photography, for improved planning and decision-making

Our coasts play a key role in Europe’s economy, safety, coastal-zone environment and well-being. One of its key characteristics, the ever-changing land-sea interface, has been monitored in the field and from the air for more than a century, and with satellites since the 1970s. This shoreline is continuously shaped by wind, waves, tides, and human influence. Shoreline change is strongly influenced by climate change. Coastal erosion in particular is exacerbated by global sea-level rise, which will put Europe’s shorelines – and others around the world – at increasing risk in the coming years. Knowing how, and at what rate, our coasts are changing is a crucial step to their sustainable management, supporting knowledge-based decision-making and thus underpinning the EU Strategy on adaptation to climate[1]. This information helps the EU move towards becoming a climate-resilient society.
The new EMODnet Geology shoreline-migration map, released today and freely accessible from the EMODnet Geology portal, allows policy makers, together with national and regional coastal managers, to determine large-scale coastal behaviour and identify areas of rapid change. It is based on field measurements and aerial photography, and covers time periods up to decades. This technique is particularly valuable for mapping cliffs, which are prevalent along European coastlines, particularly since state-of-the-art satellite-monitoring methods aren’t yet suitable for imaging erosion of non-sandy types of coastline.
Effective planning for adaptation to climate change must be underpinned by high-quality data. The new EMODnet shoreline-migration map provides the most up to date and comprehensive information for coastal and marine industries, decision-making bodies and scientific research. Providing pan-European, regional and local data, it helps enable efficiencies in planning and decision-making processes for a sustainable future
Cherith Moses, Professor of Geomorphology at Edge Hill University (UK)
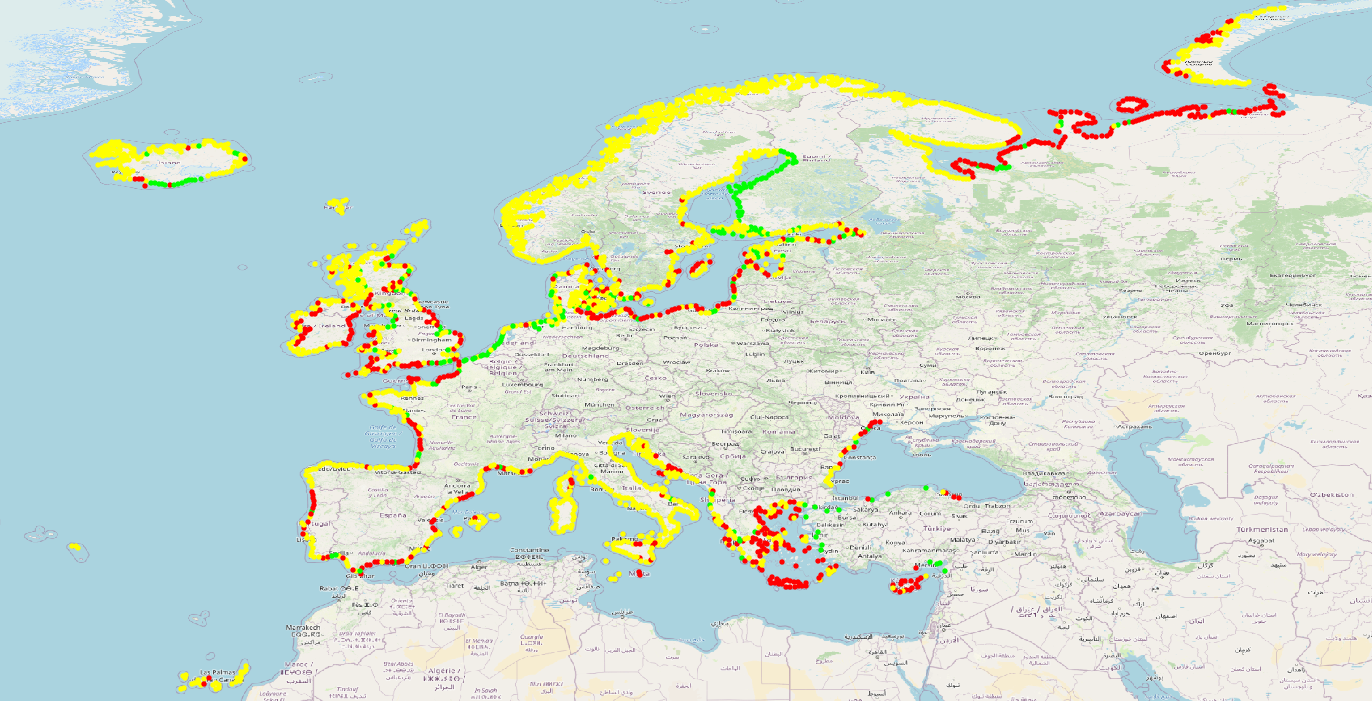
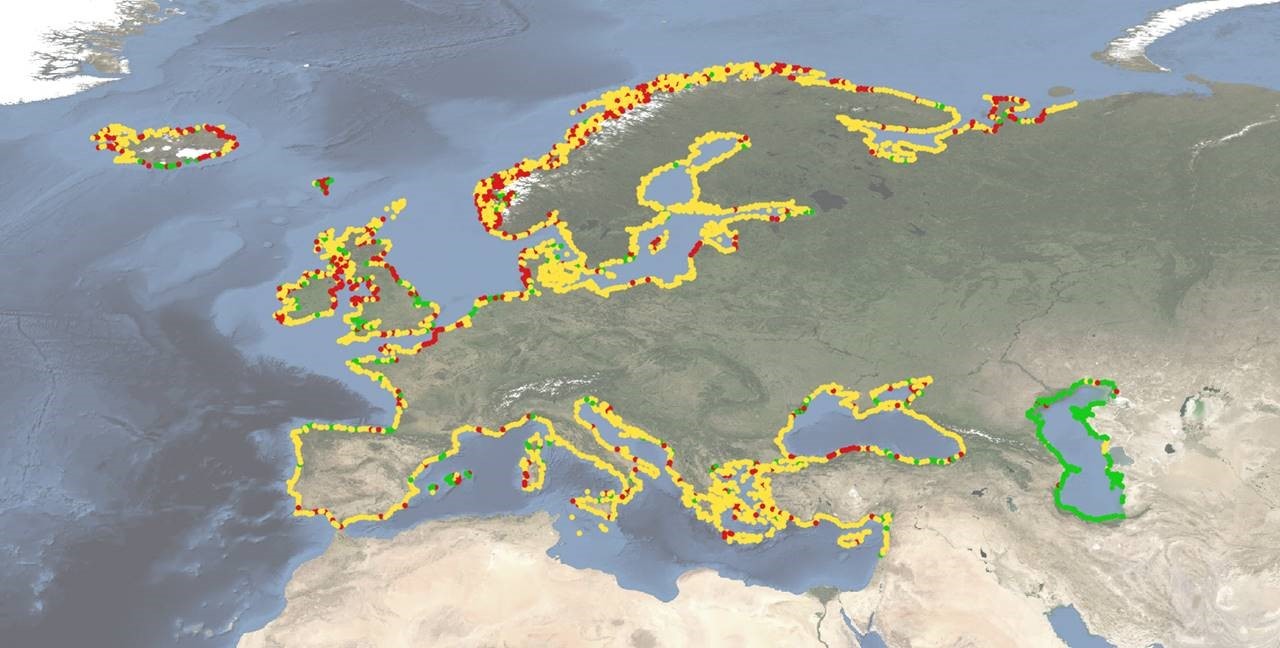
Pan-European overview maps of shoreline migration (red = landward; yellow = stable; green = seaward). Image at the top : the updated map based on field data and aerial photography. Image at the bottom : the 2019 map based on satellite monitoring. The map at the bottom has more complete coverage but tends to overestimate erosion of cliffed coasts. ©EMODnet
Visit the EMODnet Geology portal :
Please note that EMODnet is in the process to provide a central access point to its data and data products through the Central Portal in the coming months. More information will be provided soon.
[1] https://climate-adapt.eea.europa.eu/eu-adaptation-policy/strategy